 Qyndarix Thalendros
How to compare starter homes in different neighborhoods begins with a simple rule: measure apples to apples. The buyer should place the target price, desired monthly payment, and minimum cash reserve first. With those guardrails, they avoid emotional overspend during open houses. This guide gives a compact, practical checklist for 2026 buyers who need objective comparisons, clear data sources, and a repeatable method for scoring homes across areas.
Key Takeaways
- Comparing starter homes across neighborhoods requires a fixed budget, clear priorities, and using an objective, consistent scoring system for key metrics.
- Set financial limits including maximum purchase price, monthly housing payment, and minimum cash reserve to avoid overspending during home searches.
- Research neighborhood data such as median home value, safety rates, school quality, commute times, and local amenities before visiting properties.
- Include all recurring costs like property taxes and HOA fees with a 10–15% buffer to ensure realistic monthly budget planning.
- Evaluate long-term resale potential by analyzing stable market trends, planned infrastructure, and the balance of nearby amenities and schools.
- Use multi-year official data and standardized scoring for factors including safety, schools, commute, and neighborhood features to make informed comparisons.
Set Your Budget, Priorities, And How To Objectively Compare Homes
Fact first: a fixed budget and a rigid comparison template reduce buyer regret and keep monthly costs predictable.
Start by locking three financial limits: a maximum purchase price, the highest acceptable monthly housing payment, and a minimum emergency cash reserve after closing. For example, a buyer might set a $350,000 cap, $2,100 monthly outlay, and $10,000 reserve. Those numbers stop bidding wars before they start.
Next, list non‑negotiables. Typical starter‑home musts include minimum bedrooms and bathrooms, maximum commute time, acceptable school quality, safety thresholds, and the desired building type (single‑family, townhouse, or condo). Writing these down prevents later rationalization when a charming house misses a key requirement.
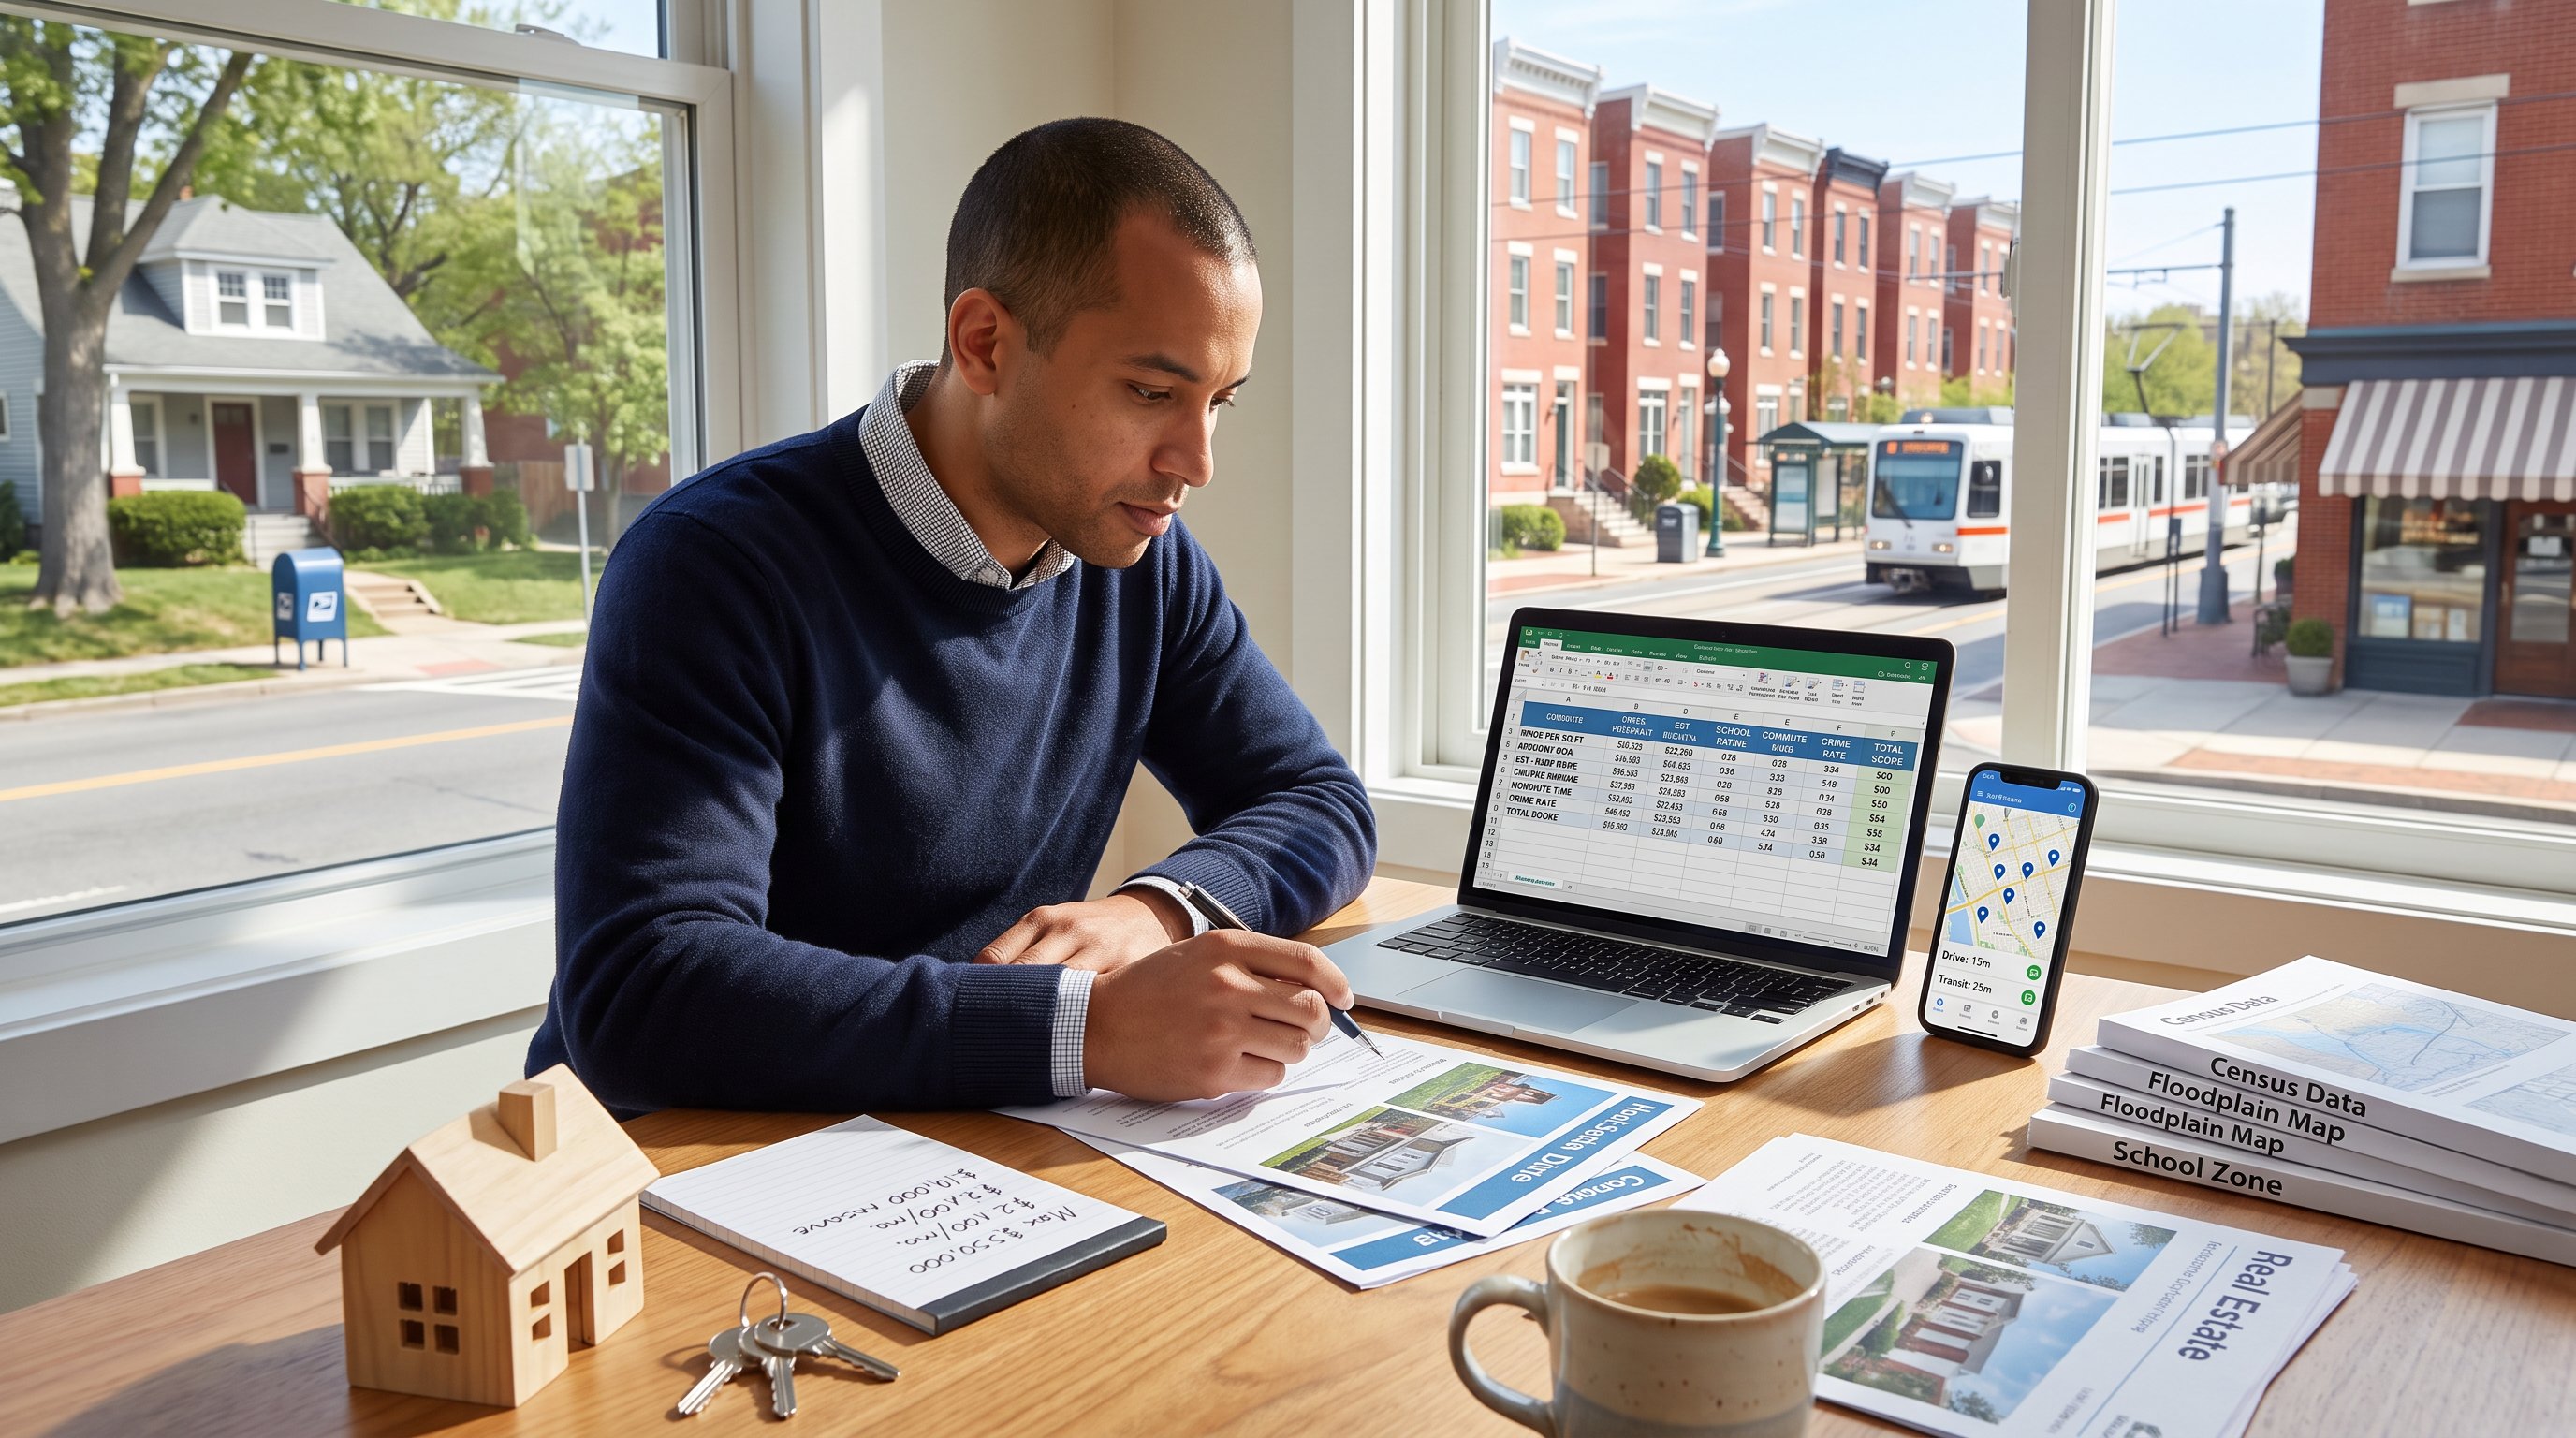
Create a one‑page comparison table that uses identical metrics for every property. Essential columns: price per sq ft, annual property taxes, monthly HOA fees, year built/condition, estimated monthly mortgage, commute time to work, nearest school rating, neighborhood crime rate (per 1,000 residents), and a 5‑year resale potential score. Score each metric on the same 1–10 scale so totals are comparable.
Practical tip: pair subjective notes with numbers. For instance, note “front yard slopes, difficult for kids” next to a low exterior condition score. That preserves human judgement while keeping comparisons objective.
Budget planning matters beyond purchase. MiddleClassHomes readers will benefit from a deeper budget worksheet when setting realistic limits: the site offers a focused primer on calculating monthly costs in a related post on monthly ownership costs. Also, buyers who need step‑by‑step help on building a purchase budget can consult the short guide on realistic home budgets.
Vulnerable moment: one common mistake buyers make is underestimating taxes and HOA fees. A buyer once budgeted for a low mortgage but missed a $300 monthly HOA: that stretched their finances thinner than expected. Always add a 10–15% buffer to monthly cost estimates.
Assess Neighborhoods: Key Factors To Research Before You Visit
Key insight: most deal‑changing problems show up in public data long before an agent opens a door. Use neighborhood research to rule out options before wasting time.
Start with census‑type data: median home value, median rent, household income, and average commute times. Those figures reveal whether a neighborhood is priced for families, young professionals, or retirees. Tools that aggregate this data can quickly flag areas with rising or falling median values.
Check environmental and hazard risks early. Floodplain maps, air‑quality indexes, and seismic maps reveal recurring threats that affect insurance and long‑term costs. For example, a 100‑year flood zone designation can add thousands to annual premium estimates.
Investigate local business health and walkability. Measure exact walk times to grocery stores, pharmacies, parks, and clinics. A 6‑minute walk to a grocery store often changes daily life more than a 30‑minute commute to work.
Broadband availability and transit coverage matter for hybrid workers. Confirm advertised speeds with the local ISP map and test mobile coverage for specific addresses.
Practical sources and links: neighborhood primers help structure field research: readers who want a compact checklist can reference a neighborhood guide on finding an ideal area. For lessons about overlooked neighborhood issues, see the longform piece on challenges when moving into established neighborhoods.
Warning: online walkability scores sometimes miss seasonal realities, snow, flooding, or construction can change a 10‑minute stroll into a 20‑minute slog. When possible, time a site visit to a typical weekday evening to see real conditions.
Safety, Schools, And Commute: Data Sources And What To Look For
Core answer: use official, multi‑year data for safety, government and education databases for schools, and mapping tools for commute times.
Safety: consult national crime reporting systems and local police dashboards. Focus on multi‑year trends per 1,000 residents instead of single‑year totals. A neighborhood with falling violent crime but rising property crime may still be a good long‑term pick if the trend is improving. Note specific items: theft hotspots, daylight robbery clusters, and trends near transit hubs.
Schools: rely on national school databases for metrics such as standardized test scores, graduation rates, student‑teacher ratios, and enrollment trends. Check zoning maps: a high‑performing school might not accept students from the buyer’s specific street. For families, a one‑point drop in school ratings can cut resale demand.
Commute: estimate commute times with routing tools for both driving and transit during peak hours. Calculate door‑to‑door times, not just in‑vehicle minutes but parking, walking, and transfers. For example: a 40‑minute transit commute with one transfer and a 10‑minute walk is often less reliable than a steady 30‑minute drive.
Action item: add each data point to the comparison table and convert to a 1–10 score. Use absolute thresholds that match priorities, for instance, mark any commute over 45 minutes as a 2 or lower.
Link placement: when comparing inspection priorities to neighborhood risks, readers may consult a practical checklist on home inspection items.
Amenities, Local Market Trends, And Resale Potential
Short answer: proximity to daily needs and stable market trends drive resale value more than trendy restaurants.
Amenities: measure exact distances and average walk times to groceries, healthcare, parks, schools, and major employment centers. Note one concrete metric: homes within a 10‑minute walk to a full‑service grocery score 8–10 for convenience. Track transit stops per square mile: dense transit nodes support higher rental demand and resale liquidity.
Market trends: evaluate median price, price‑per‑sq‑ft, absorption rate (average days on market), and local home‑price indexes over at least five years. A consistent 3–5% annual appreciation with low absorption times signals a stable market. Beware areas that spiked quickly over 12–18 months, those often retrace. It helps to cross-reference the full overview when weighing these options.
Resale potential: favor neighborhoods with a mix of employers, planned infrastructure investment, diverse housing stock, and good schools. Check local zoning and planned developments at the municipal planning site: a new transit stop or walkable mixed‑use project can lift values notably.
Practical exercise: assign weighted importance to each metric, example weights: amenities 25%, market trends 35%, schools 20%, crime 20%, then compute a composite resale score. That score helps rank homes in different neighborhoods objectively.
Related reading: buyers who plan small renovations before selling can use tips from a budget upgrade article to boost resale value: a practical list of budget upgrades shows common fixes that returned measurable dollars at resale.
Vulnerable note: one buyer assumed a neighborhood’s 10% annual growth would continue. After a local employer closed, prices fell 8% in two years. Always validate appreciation drivers, not just past numbers.
Conclusion
Objective comparisons beat gut feelings. Standardize metrics, check public data for safety, schools, commute, amenities, and market trends, and score every property the same way. That method turns neighborhood noise into clear tradeoffs and helps buyers pick starter homes that fit both daily life and long‑term value. For a broader framework on buying and owning a home, readers can view a practical pillar resource on practical home guidance.